IIn today’s digital age, Americans are more connected than ever before, spending an average of 6.4 hours daily using the internet. This profound shift in how we consume information, communicate, and entertain ourselves has transformed the social media landscape into a mobile-first environment. As we dive into the latest statistics from 2024, we’ll explore how mobile social media has become an integral part of daily life in the United States.
Digital Population Overview
The United States has reached unprecedented levels of digital connectivity in 2024. According to the latest data, there are approximately 331 million internet users across the country, representing nearly the entire population. Within this digital ecosystem, 239 million Americans actively use social media platforms, highlighting the massive adoption of these communication channels.
Perhaps most striking is that over 90% of U.S. internet users access the web through mobile phones. This mobile-first reality has fundamentally changed how businesses approach digital marketing and how platforms design their user experiences.
Mobile Internet Penetration Growth
The trajectory of mobile internet adoption in the United States shows no signs of slowing down. In 2024, mobile internet penetration has reached 89.78%, marking a significant increase from 76.2% in 2020. By 2029, experts project this figure will climb to 92.51%, indicating that virtually every American will be connected via mobile devices.
This consistent growth trajectory demonstrates the increasing reliance on mobile technology for internet access, making it crucial for businesses to optimize their digital presence for mobile users.
Daily Media Consumption Habits
The average American’s daily media diet reveals fascinating insights into how we allocate our attention in the digital age. During the third quarter of 2024, U.S. internet users spent an impressive 6.4 hours per day using the internet, with a significant portion dedicated to mobile activities.
Breaking down these numbers:
- 4.55 hours watching television (broadcast and streaming)
- 2.09 hours using social media platforms
- 1.46 hours listening to music streaming services
- 1.21 hours reading press media (online and physical)
Social media consumption has become a cornerstone of daily routines, accounting for nearly one-third of total internet usage time. This shift represents a fundamental change in how Americans consume content and interact with media brands.
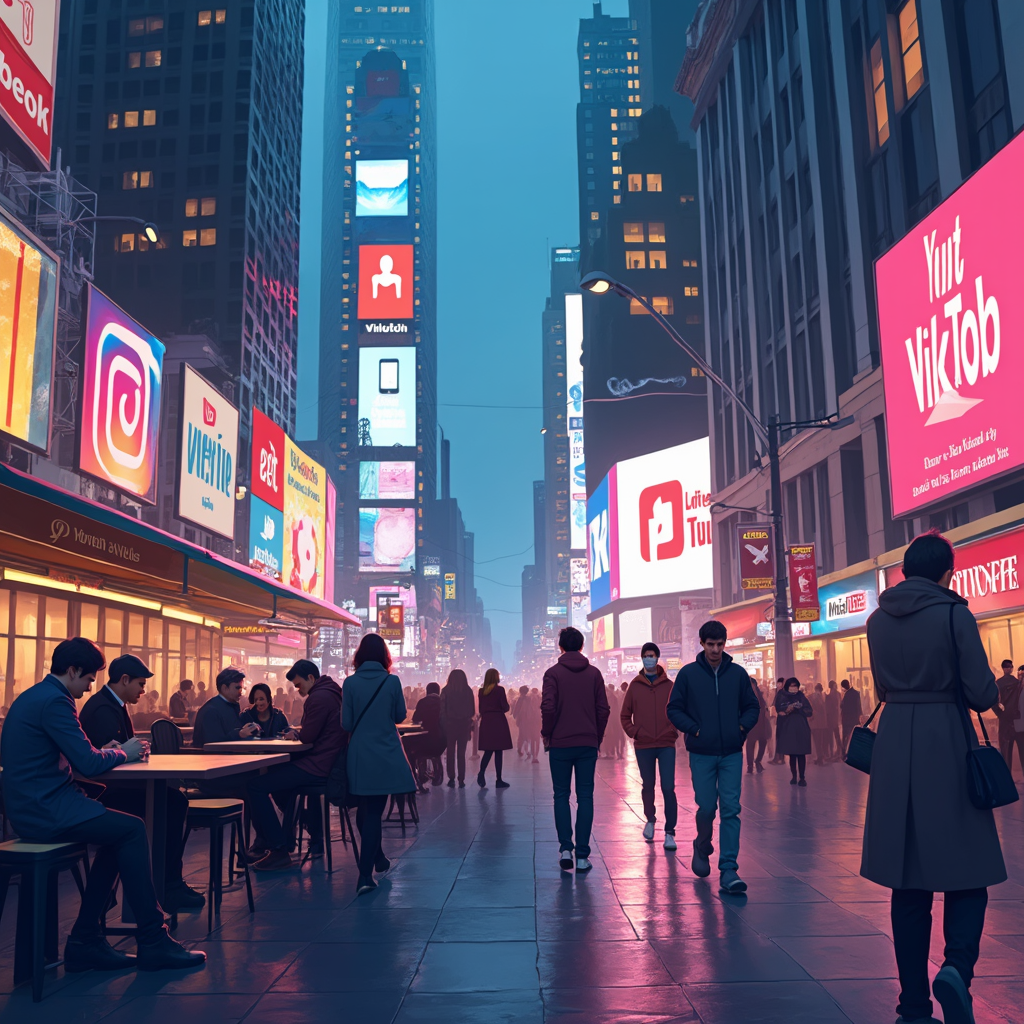
Social Media Platform Landscape
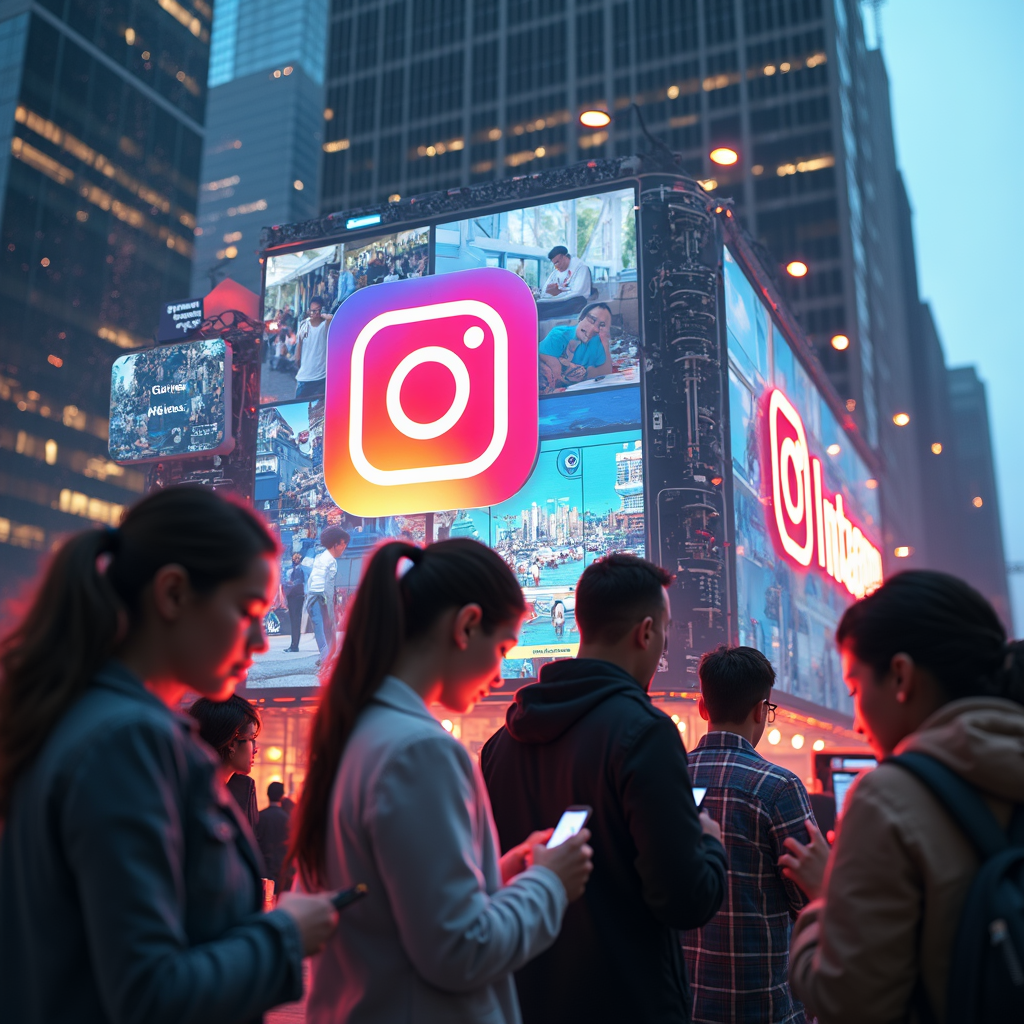
The social media ecosystem in the United States is dominated by a few major players, each serving different user needs and demographics. In terms of brand awareness, YouTube leads with 96% recognition, followed closely by Facebook at 95% and Instagram at 93%.
However, awareness doesn’t always translate to usage. When examining actual platform usage:
- Facebook maintains the top position with 70% of social media users
- YouTube follows with 62% active users
- Instagram engages 50% of the social media audience
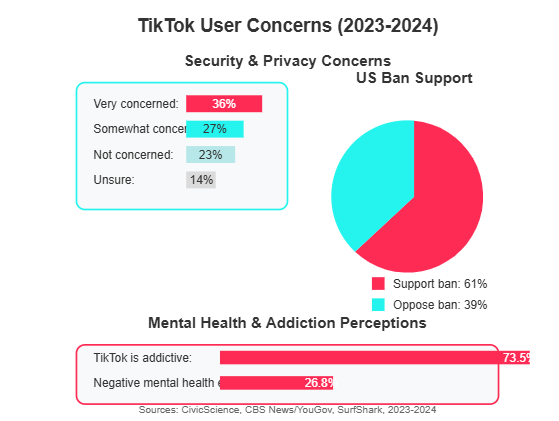
- TikTok, despite its recent rise, reaches 41% of users
- Snapchat serves 28% of the social media population
This distribution showcases the diverse preferences among American social media users, with established platforms maintaining strong positions while newer entrants like TikTok continue to gain ground.
Mobile vs. Desktop: The Shift in Web Traffic
The dominance of mobile devices is clearly reflected in web traffic patterns. In November 2024, mobile phones generated 55.45% of all web traffic in the United States, while laptops and desktops accounted for 42.3%. Tablets contributed a modest 2.2% of total traffic.
This distribution emphasizes the critical importance of mobile optimization for websites and digital content. For businesses, it’s no longer optional to have a mobile-friendly presence—it’s essential for reaching the majority of online users.
Key Trends and Insights
Several significant trends emerge from the 2024 data:
- Mobile-First Reality: With over half of web traffic coming from mobile devices and 90% of internet users accessing via mobile, the mobile-first approach is now standard rather than innovative.
- Social Media Dominance: Social media apps top the list of most-used smartphone applications, with 63% of users prioritizing these platforms over other app categories.
- Video Content Growth: The high engagement with platforms like YouTube and TikTok underscores the continuing rise of video content as the preferred format for many users.
- Platform Diversification: Users maintain active profiles across multiple platforms, with the average person using 3-4 different social media services regularly.
- Generational Differences: Younger demographics show stronger preferences for newer platforms like TikTok, while older users tend to stay with established platforms like Facebook.
Future Projections
Looking ahead to 2028, several projections paint a picture of continued growth and evolution:
- Social media users are expected to continue growing, though at a slower rate as market saturation approaches
- Mobile internet penetration will near universal coverage at 92.51% by 2029
- Platform preferences may shift as new technologies emerge and user behaviors evolve
- The lines between social media, entertainment, and e-commerce will continue to blur
For businesses and marketers, these projections suggest the need for:
- Continued investment in mobile-optimized content
- Diversified social media strategies across multiple platforms
- Increased focus on video content creation
- Adaptation to changing user preferences and behaviors
Conclusion
The state of mobile social media in America reflects a mature digital ecosystem where mobile devices serve as the primary gateway to online experiences. With 239 million social media users and growing, the influence of these platforms on American culture, commerce, and communication continues to expand.
As we move forward, the mobile-first reality will only intensify, making it crucial for businesses to adapt their strategies accordingly. Understanding these trends and statistics isn’t just about staying informed—it’s about remaining competitive in an increasingly digital marketplace.
For marketers, content creators, and business leaders, the message is clear: mobile social media isn’t just a channel; it’s the primary arena where brands connect with consumers. Those who embrace this reality and adapt their strategies will be best positioned to succeed in the evolving digital landscape.
Stay tuned for our next article in this series, where we’ll dive deep into platform-specific statistics and compare Instagram, TikTok, and Snapchat’s performance in the U.S. market.